The ___est neighborhoods in the Capital Region
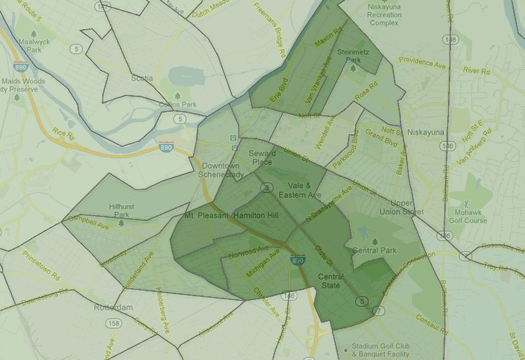
Schenectady leads the Capital Region in racial diversity. (The deeper the shade of green, the more diverse the neighborhood.)
Location. Location. Location.
It's a cliche, but it doesn't make it any less true: location is among the most important factors in real estate. It can significantly affect the value of a house -- and significantly affect how much you like living there.
Of course, physical factors like roads, trees, and access to services are a big part of location. But so are the people in your neighborhood.
To get a better sense of some general demographic characteristics about Capital Region neighborhoods -- age, ethnic diversity, income, education, and so on -- we pulled data for all 210 Census tracts in the four county area.
Here are some of the ____-est neighborhoods...
![]()
Important notes: All of these data are from Census Bureau, and the numbers represent what the Census collected in 2010. Obviously, some things have changed since then. Also: some of these numbers are estimates from the American Community Survey -- and because of how that's collected and the relatively small populations of Census tracts, the margins of error for those estimates can be large. In other words: the numbers are a general impression, not necessarily exact. It's worth keeping that in mind.
About tracts: Census tracts are supposed to approximate neighborhoods, but that's not necessarily always going to be the case -- especially by the Capital Region's sometimes exacting standards for what is/isn't part of a certain neighborhood.
Regarding Census tract maps: the lines for tracts have been smoothed, so they might not exactly represent the boundaries of tracts in some cases.
Age
Tracts mapped by median age. The deeper the green, the older the median age for the neighborhood.
Youngest
Based on median age.
1. Saratoga Springs, including and around Skidmore - 20.1
2. Albany, north side of UAlbany's uptown campus - 20.4
3. Albany, Pine Hills, north and west of St. Rose - 21.3
4. Guilderland, McKownville near UAlbany - 21.4
5. Schenectady, around Union College - 21.4
Not a surprise, especially when you look at Skidmore's tract -- it's basically just the college and wooded area just to the north.
Oldest
Based on median age.
1. Albany, Washington Ave Ext/Pine Bush - 63.7
2. East Greenbush, easter side - 51.1
3. Albany, Buckingham Lake-Crestwood - 50.2
4. Edinburg, northwestern corner of Saratoga County - 49.2
5. Albany, downtown - 48.5
Again, probably not a surprise -- the oldest tract includes a strip of retirement homes.
Most 20 and 30somethings
Total number.
1. Albany, north side of UAlbany uptown campus
2. Albany, Pine Hills around Quail Street
3. Loudonville, Siena College and east
4. Albany, Pine Hills around Ridgefield Park
5. Troy, RPI campus east
Most kids
Total number, 18 and under.
1. Wilton, west of I-87
2. Bethlehem, south of Feura Bush Road
3. Guilderland, north of Western Ave
4. Albany, Arbor Hill/Sheridan Hollow
5. Malta, west of Saratoga Lake
Diversity
The deeper the shade of green, the higher the tract's diversity score.
Note: We scored Capital Region tracts using a formula that measures how evenly distributed the population of that tract is by reported race. So a tract in which the population is evenly distributed among every group would be scored "1." A tract in which there were only people of one group would be scored "0." (The formula is from this paper about measuring diversity within a Census tract -- it's a bit technical, but there if you'd like to read it.) Also: for the purposes of scoring tracts, we dropped the "Native Hawaiian-Pacific Islander" group -- only a tiny number of Capital Region tracts included someone from that group, and the percentages in those tracts were very small -- many just .1 percent (dropping the group made running the calculation easier).
Most racially diverse
As scored.
1. Schenectady, Hamilton Hill - score: .71
2. Schenectady, Central State, north of State Street - score: .70
3. Schenectady, Central State, south of State Street - score: .67
4. Schenectady, Mont Pleasant south - score: .66
5. Schenectady, Vale and Eastern Ave - score: .65
As it happens, the top 6 tracts for diversity were in Schenectady. The first non-Schenectady tract: Albany, Central Ave near Quail - score: .6
Least racially diverse
As scored above.
1. Albany County, around Knox - score: .06
2. Saratoga County, northwest corner, Edinburg - score: .06
3. Saratoga County, Galway - score .06
4. Saratoga County, Moreau - score: .07
5. Rensselaer County, northwest corner - score: .07
Economic and education
Highest income
Highest median household annual income.
The deeper the shade of the green, the higher the median income.
1. Niskayuna, east of Balltown Road - $116,288
2. Saratoga, east and south of Saratoga Springs - $114,722
3. Niskayuna, south of Rosendale Road - $108,393
4. Clifton Park, Country Knolls - $108,015
5. Loudonville, west of Loudon Road and south of Osborne Road - $106,216
Most educated
Highest percentage of residents over 25 with at least a bachelor's degree. This is from the American Community Survey 2010, so differences of a few percentage points aren't necessarily much of a difference.
1. Niskayuna, east of Balltown Road - 73 percent
2. Loudonville, west of Loudon Road and south of Osborne Road - 70 percent
3. Albany, Center Square/Washington Park - 68 percent
4. Bethlehem, Delmar - 65 percent
5. Niskayuna, south of Rosendale Road - 64
Not surprising there's an overlap among some of the highest income tracts and the most educated tracts.
Relationships
The deeper the shade of green, the higher the percentage of households that include a married couple.
Most married households
Percentage of households in a tract that include a married couple. Important note: the Census Bureau hasn't made available tract-level data for same-sex marriages -- so in this case, "married" refers to a man and woman.
1. Niskayuna, east of Balltown Road - 27 percent
2. Saratoga County, Charlton - 27 percent
3. Clifton Park, Ballston Lake - 27 percent
4. Clifton Park, Ushers - 26 percent
5. Schenectady County, Glenville - 26 percent
Biggest families
Average family size in the a tract. A family is defined by at least two people living together who are related by birth, marriage, or adoption.
1. Schenectady, Hamilton Hill - 3.53
2. Albany, Central Ave around Quail Street - 3.42
3. Albany, West Hill - 3.38
4. Troy, North Central - 3.37
5. Schenectady, Central State north of State Street - 3.37
Most people living alone
Percentage of all households that are a person living alone.
1. Albany, downtown - 74 percent
2. Schenectady, north Bellevue - 69 percent
3. Schenectady, downtown - 68 percent
4. Albany, Center Square/Washington Park - 65 percent
5. Saratoga Springs, downtown - 58 percent
_____
There are large-format versions of the maps embedded at the top of the page -- scroll all the way up. The map are interactive -- so you can click on a census tract to get more info. The maps include info for more categories than in the lists above.
Thanks to CM for the statistical help.
Real Estate Week:
+ Living in downtown Albany: a look at the growing options
+ What $175,000 buys you in the Capital Region
+ What $225,000 buys you in the Capital Region
+ What $350,000 buys you in the Capital Region
+ A home where you don't have to turn on the heat
Hi there. Comments have been closed for this item. Still have something to say? Contact us.
Comments
Now isn't this great info - and doesn't it make sense for local governments to have this information at hand?! Of course!
So what were bone-headed republicans thinking when they voted to eliminate it?
"This survey is inappropriate for taxpayer dollars,†Webster added. “It’s the definition of a breach of personal privacy. It’s the picture of what's wrong in Washington, D.C. It's unconstitutional.â€
The picture of what's wrong with Washington?! Understanding population trends? OMFG. We're doomed.
... said daleyplanit on Jul 12, 2012 at 3:33 PM | link
The maps could benefit from a legend. Otherwise, very nice job.
Editors: You're right about the lack of a legend. Better descriptions have been added. Thanks.
... said Rob on Jul 12, 2012 at 9:05 PM | link
Somebody at AOA is a stats geek. :)
Where are the crime maps? How about property tax and housing prices?
Actually you guys did a great job, regardless of the criticism above.
... said bk on Jul 12, 2012 at 10:26 PM | link
May I add "the worst commute"?
1. Clifton Park.
2. Clifton Park.
3. Clifton Park.
... said Lu on Jul 13, 2012 at 8:13 AM | link
So I'm not crazy, my neighborhood as so many kids. SO MANY. America's future is all doing sidewalk chalk in Bethlehem, NY.
... said Capitol to Capital on Jul 13, 2012 at 10:20 AM | link
I live just south of the 4 corners in Delmar. I feel like my neighborhood is changing a bit. A lot of the houses are still owned by the elderly, but a lot seem to be getting sold to the "early 30s, 1 or 2 kids" set. The present housing market gave a lot of younger families (mine included) the opportunity to buy into properties that would have been rather inaccessible during the height of the market. This is good, it will breath more life into the community.
... said Mr. Dave on Jul 13, 2012 at 1:28 PM | link
Block group level for more granularity please.
... said Welf on Jul 13, 2012 at 4:25 PM | link
Fascinating - really, really proud that Schenectady is the most diverse; really, really not surprised that Saratoga County is the least diverse. Love the income and education levels near Upper Union Street and Niskayuna. This is amazing demographic information for re-locators - business and residential! Location, location, location!
... said Joanne on Jul 15, 2012 at 11:29 AM | link